

Finance
Finance gives you SKU-level profitability across every connected marketplace. It pulls in fees, returns, and adjustments automatically, so you can see what you’re actually making on each product, not just what you sold.
Overview
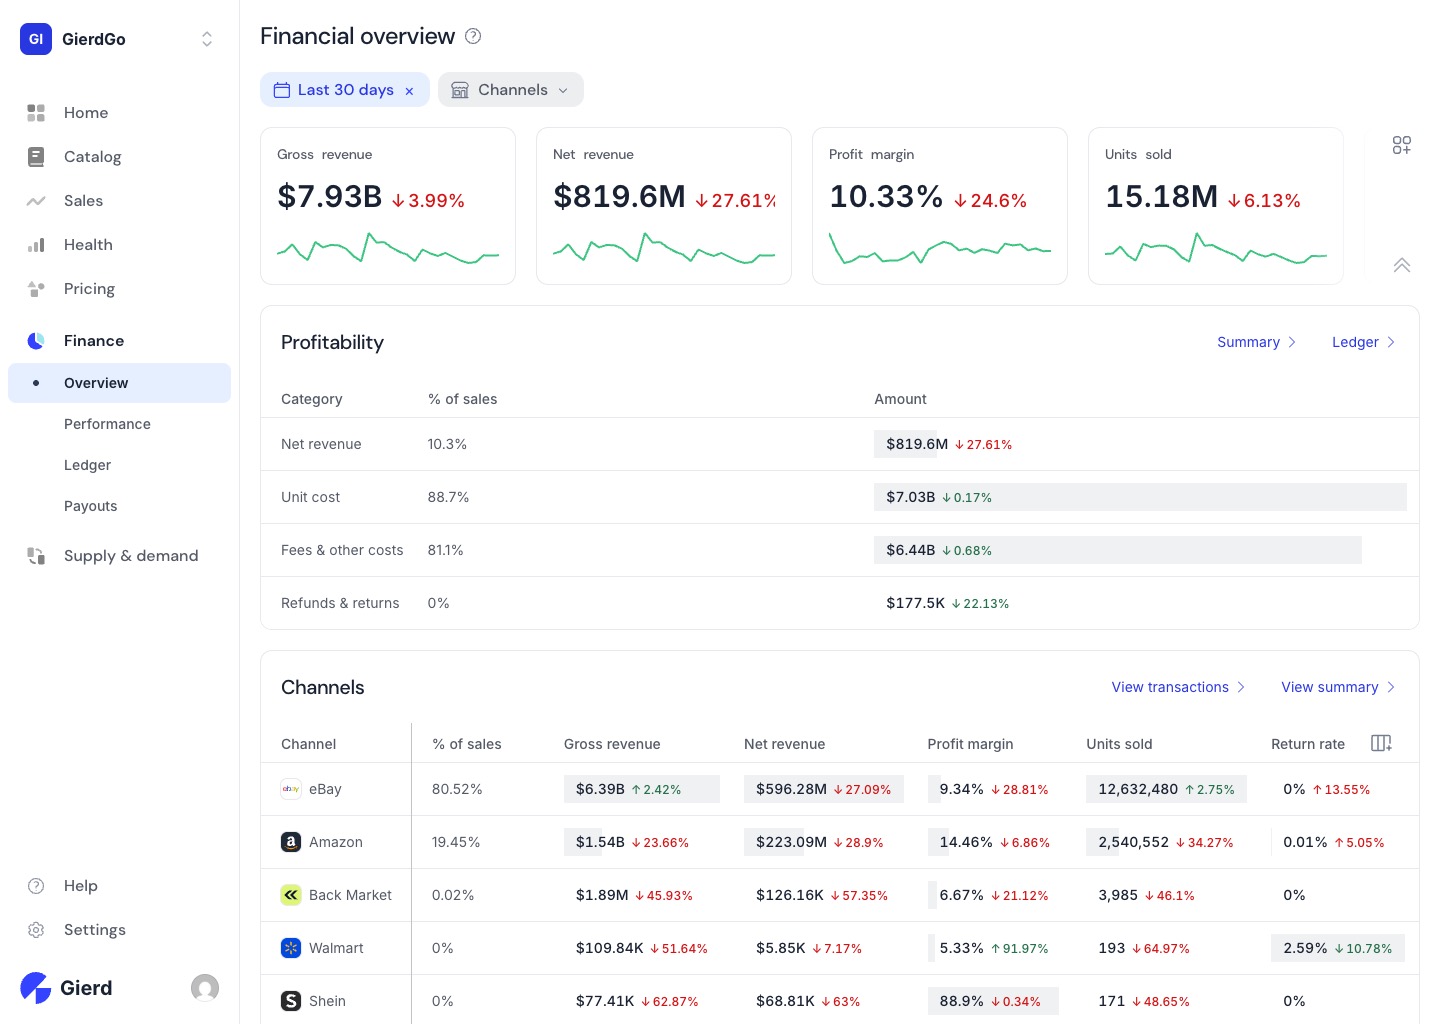
Section titled “Overview”The Overview shows your top-line financial metrics — gross revenue, net revenue, profit margin, and units sold — with period-over-period comparisons. Below the metrics, a profitability breakdown shows how revenue flows down through unit costs, fees, and refunds to arrive at net. The channel table breaks all of this down by marketplace so you can see exactly where your margin is coming from.
Performance
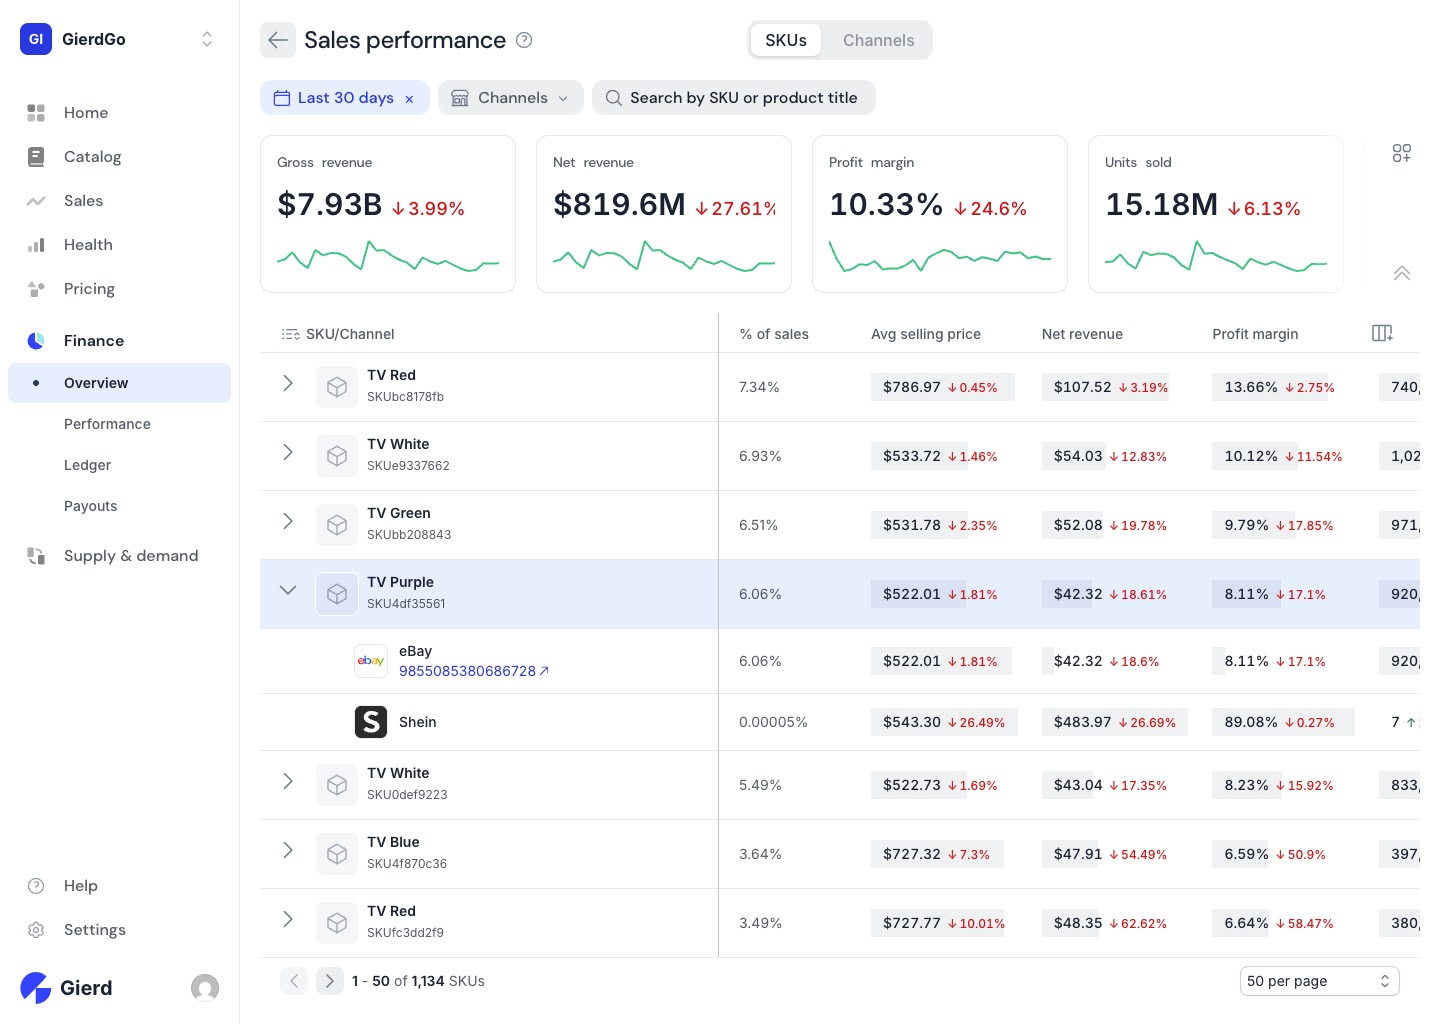
Section titled “Performance”Performance is the SKU-level view. It shows each product’s share of sales, average selling price, net revenue, and profit margin. Expand any row to see the same breakdown by channel — useful for spotting products that perform well on one marketplace and poorly on another.
Ledger
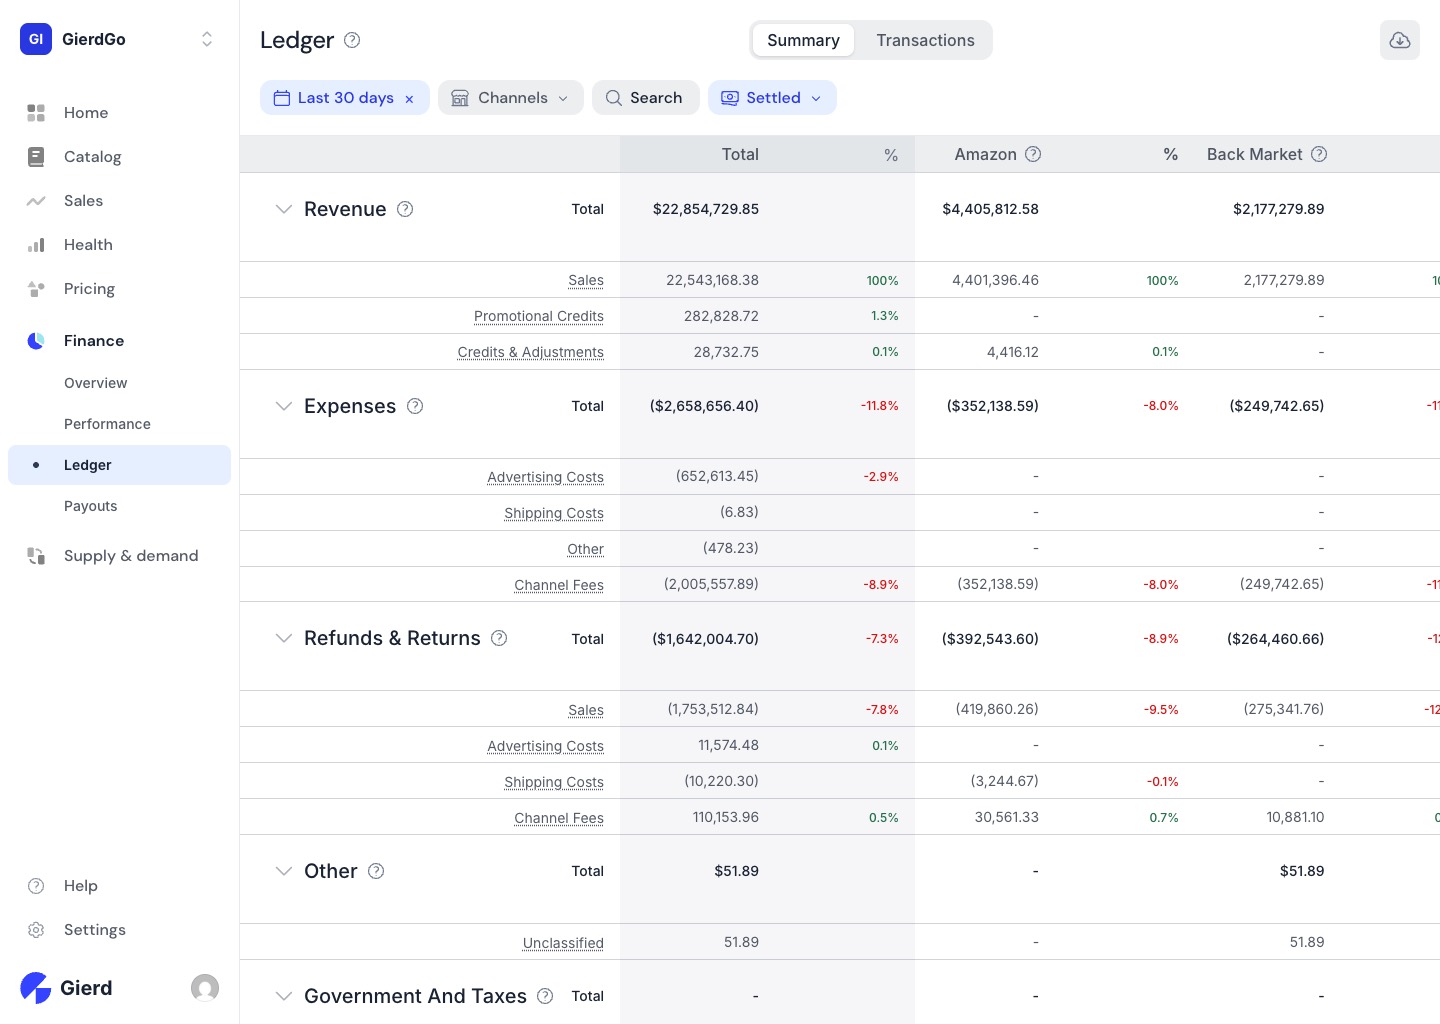
Section titled “Ledger”The Ledger records every marketplace transaction in one place. The Summary view organizes everything into categories — Revenue, Expenses, Refunds & Returns — with totals and per-channel columns side by side. Switch to the Transactions view to see individual line items. It’s the single source of truth for what’s happened financially across your channels, without logging into each marketplace separately.
Payouts
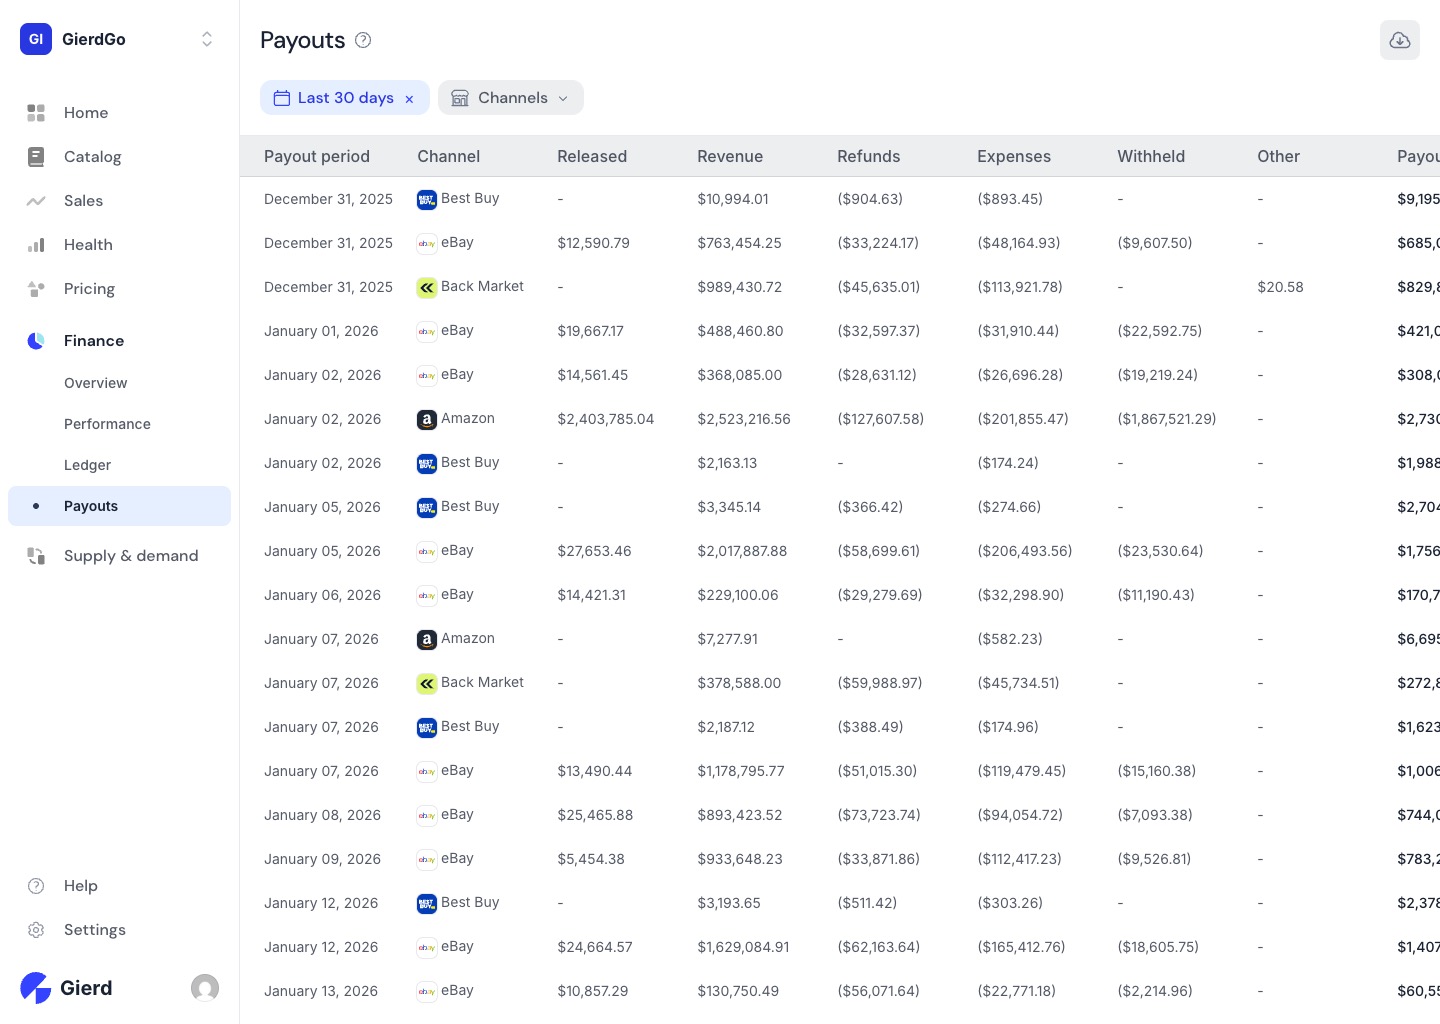
Section titled “Payouts”Payouts tracks the settlement transfers from each marketplace to your bank account. Each row shows the payout period, channel, revenue, refunds, expenses, withheld amounts, and the net payout — everything you need to reconcile your bank deposits against your marketplace activity.
Next, we’ll look at how Supply & demand turns your sales history into forward-looking inventory recommendations.