

Sales
Sales shows how your products are performing across all connected marketplaces. Use it to track order volume, identify trends, and spot products that need attention.
Marketplace Sales
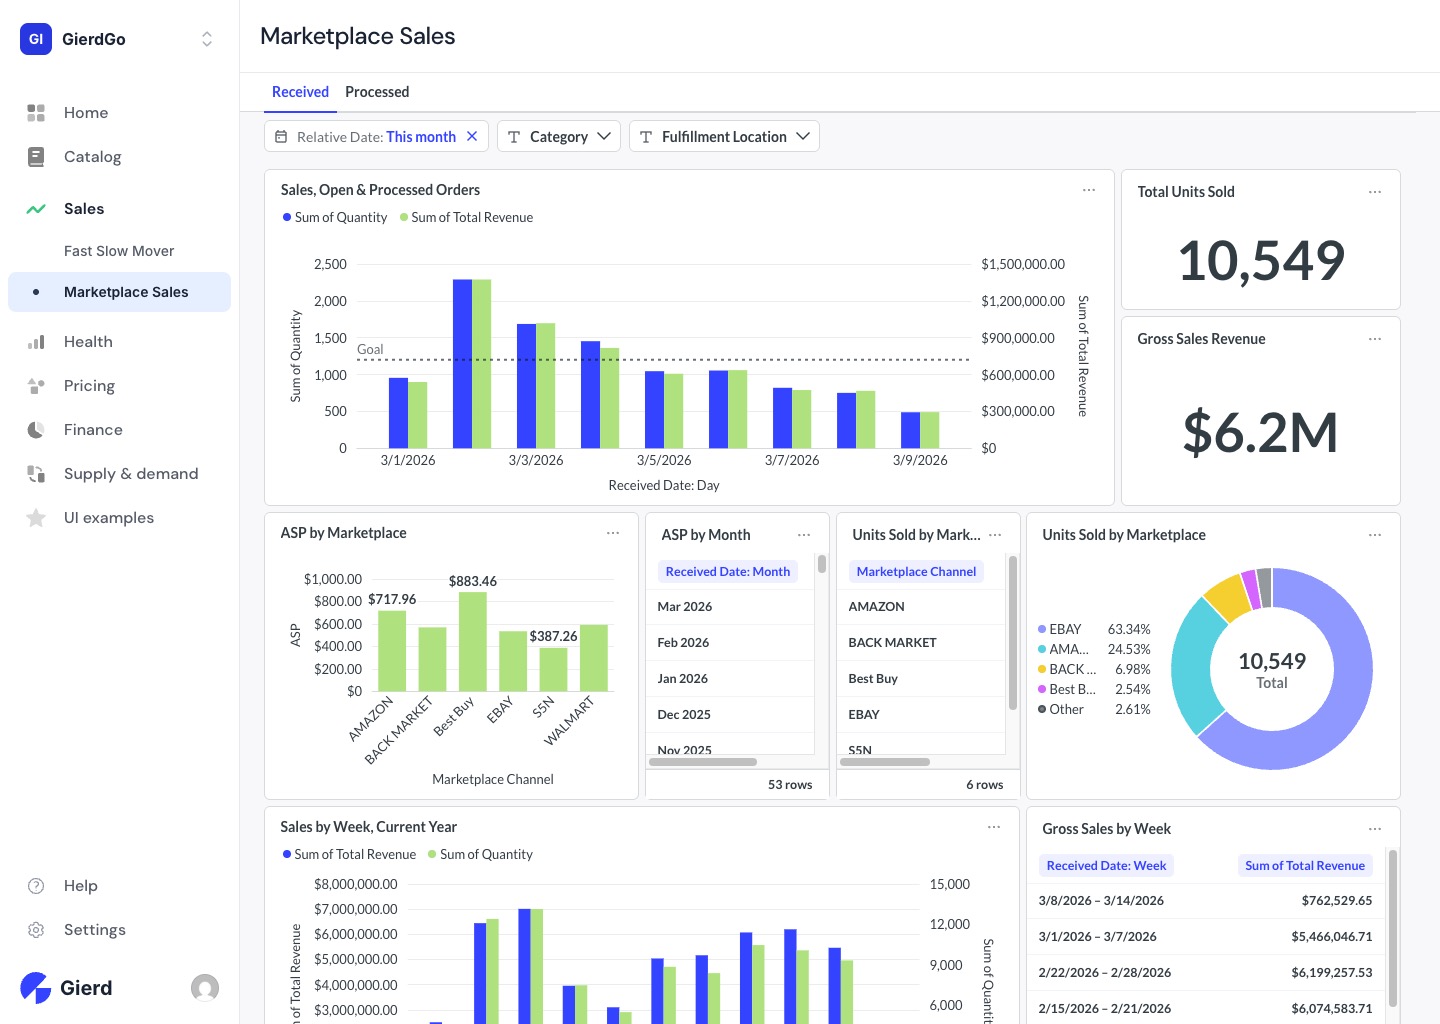
Section titled “Marketplace Sales”Marketplace Sales is your primary sales view. It breaks down orders, revenue, and fees by channel and time period, with filters for date range, category, and fulfillment location.
The Received tab shows orders as they come in; the Processed tab shows orders once they’ve been fulfilled. Charts include daily order volume and revenue, average selling price (ASP) by marketplace, units sold by channel, and weekly revenue trends — all useful for answering questions like “which channel drove the most revenue this month?” and “how did that compare to the month before?”
Fast & Slow Movers
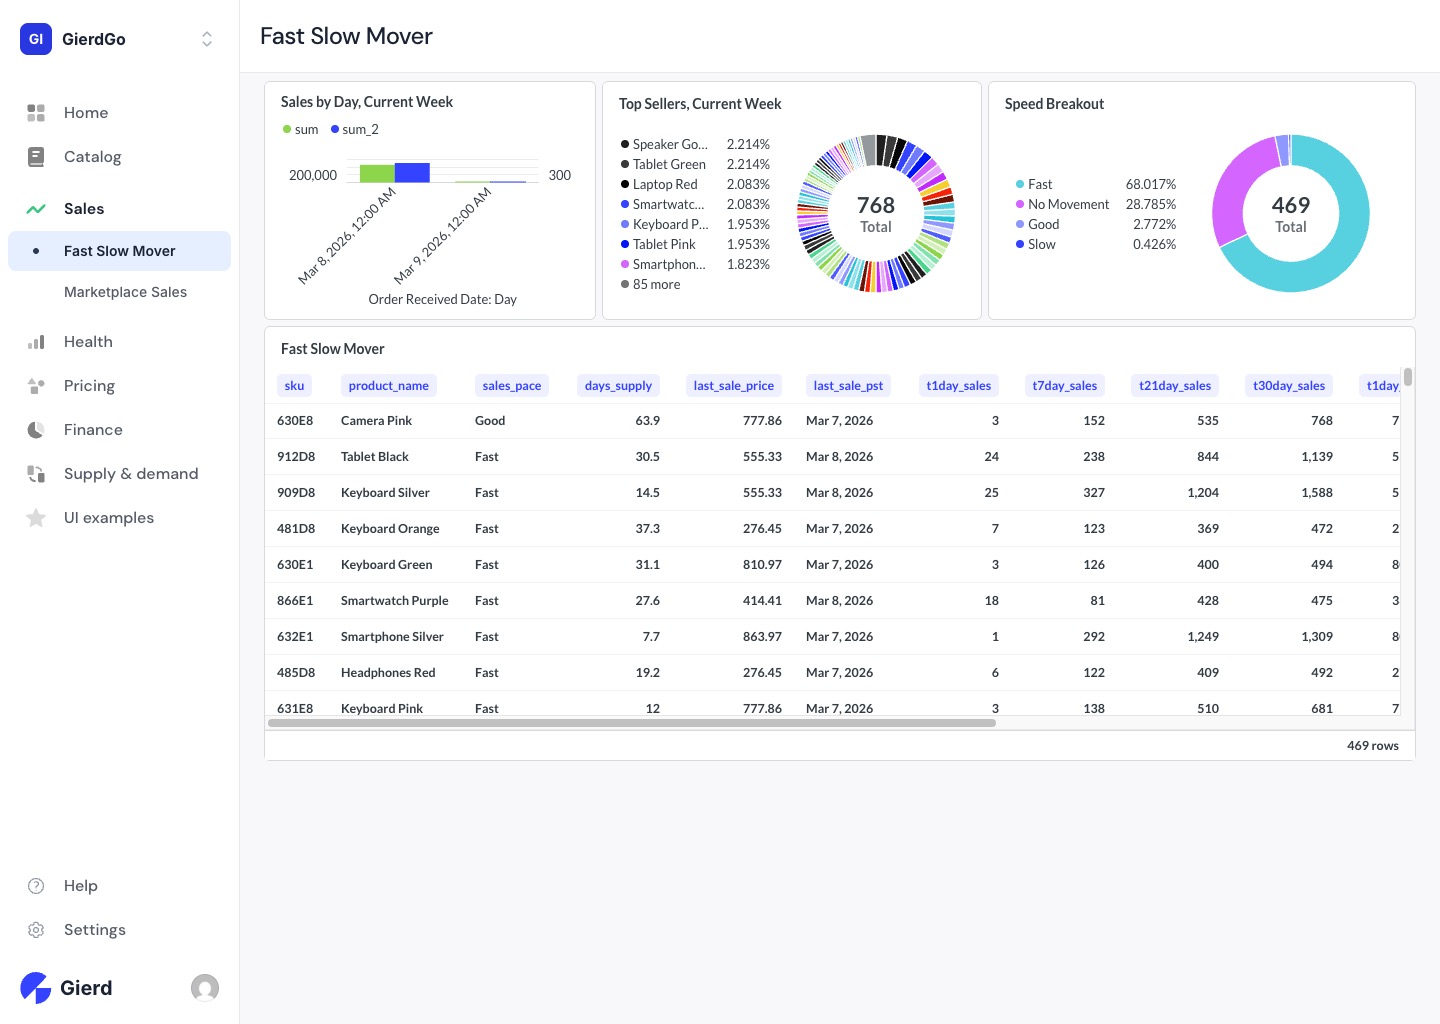
Section titled “Fast & Slow Movers”Fast & Slow Movers ranks your products by sales velocity — how quickly they’re selling relative to your inventory on hand. The summary charts at the top show your top sellers by revenue share and a speed breakout across Fast, Good, Slow, and No Movement categories.
The table below lets you dig into individual SKUs, showing days of supply, last sale price, and sales over the past 1, 7, 21, and 30 days. Fast movers may need restocking; slow movers may need a price adjustment or promotional push before they tie up capital.
Velocity rankings improve over time — the more sales history Gierd has synced, the more accurate the picture.
Next, we’ll look at how Pricing keeps your listings competitive while protecting your margins.